Aloha from the Hawaii State Data Center
The Hawaii State Data Center (HSDC) is an officially designated source of Census Bureau data for the State of Hawaii under a joint federal-state agreement with the U.S. Census Bureau relating to the national State Data Center Program.
What’s New
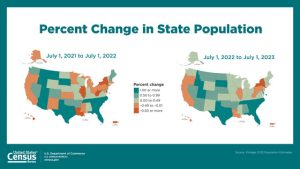
2023 COUNTY POPULATION ESTIMATES RELEASEDMarch 14, 2024. The U.S. Census Bureau released its county-level Vintage 2023 Population Estimates today. The release contained population data for 2020 to 2023. Final revisions to the 2010 to 2019 Population Estimates Series are expected in Fall 2024. Between July 1, 2020 and July 1, 2023 the state population declined at an average rate of […]
Read More 2023 COUNTY POPULATION ESTIMATES RELEASED 2023 STATE POPULATION ESTIMATESThe U.S. Census Bureau released its 2023 state population estimates today. The latest estimates include the Vintage 2023 estimates for 2020 through 2023. Hawaii’s latest population estimates and components of change data are now available on our Population Estimates webpage. HAWAII HIGHLIGHTS On July 1, 2022, the resident population for the State of Hawaii was 1,439,399. On […]
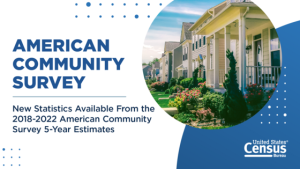
Read More 2023 STATE POPULATION ESTIMATES 2018-2022 AMERICAN COMMUNITY SURVEY 5-YEAR DATA RELEASEDDecember 7, 2023. The U.S. Census Bureau Released the 2018-2022 American Community Survey (ACS) 5-year. The 2022 ACS 5-year estimates are available on data.census.gov, which is the census Bureau’s platform to access data and digital content. Many new detailed tables were added in this release, including new tables on housing, earnings, language spoken at home, […]
Read More 2018-2022 AMERICAN COMMUNITY SURVEY 5-YEAR DATA RELEASED Read More Entries from Whats New ReleasesThe Hawaii State Data Center is a local source that distributes census data; assists the public in the use of census data by providing technical advice; educates the public by providing guides and sponsoring training on census data, products and tools; and maintains a network of affiliate organizations throughout the state.
This website provides Hawaii specific census data which are included in various products such as profiles, data highlights, reports and maps. They are available for different geographic areas from the national level to the small areas such as census tracts and blocks, depending upon the data and product of interest.
HSDC is a part of the Research and Economic Analysis Division (READ) of the Hawaii State Department of Business, Economic Development & Tourism. Other federal-state cooperative programs within READ include the Federal-State Cooperative for Population Estimates (FSCPE) and the Federal-State Cooperative for Population Projections (FSCPP).
Get to know Hawaii Census Data
ACS 2018-2022 maps for the state, census tracts, state legislative districts, and counties